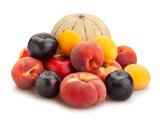
Jan 29, 2013 (CIDRAP News) – After scrutinizing a decade's worth of data on foodborne disease outbreaks, federal health officials estimate that produce was the vehicle in close to half of all illnesses and that poultry was the culprit in 19% of all deaths.
The report released today by the Centers for Disease Control and Prevention (CDC) covers data from 1998 to 2008. It says that produce of all kinds was implicated in 46% of illnesses and 23% of deaths. A high number of produce-linked norovirus outbreaks was a major factor in the big contribution from produce.
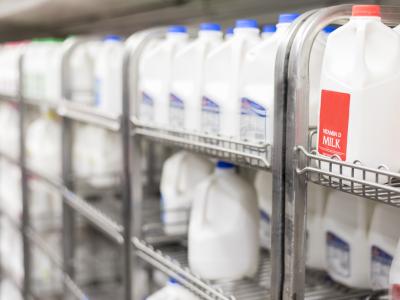
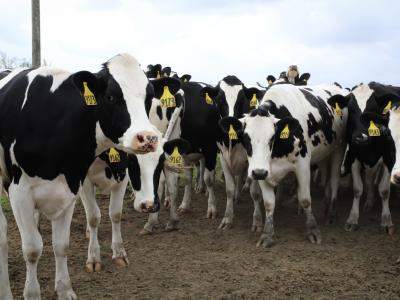
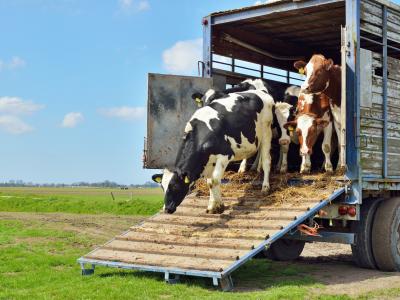
In other findings, the analysts estimated that contaminated meat and poultry together were to blame for 22% of cases and 29% of deaths, while dairy and eggs accounted for 20% of illnesses and 15% of deaths. Fish and shellfish were implicated in 6.4% of illnesses and 6.1% of deaths.
The study was published today as an early release from the March issue of Emerging Infectious Diseases.
In a question-and-answer article accompanying the report, the CDC said it is the most comprehensive effort to determine which foods cause illness on the basis of outbreak data, including outbreaks involving "complex foods"—those containing foods from more than one category.
"To the extent that these outbreak-based estimates reflect the commodities associated with all foodborne illness, they indicate that efforts are particularly needed to prevent contamination of produce and poultry," the report states.
The findings come just a few weeks after the US Food and Drug Administration (FDA) issued its long-awaited draft rule for preventing contamination of produce. The rule is one of the major steps to implement the FDA Food Safety Modernization Act, which was enacted 2 years ago with the aim of shifting the US food safety system to more of a preventive footing.
More than 4,500 outbreaks
The CDC authors mined data from the agency's Foodborne Disease Outbreak Surveillance System, looking at all outbreaks from 1998, the first year with detailed information on foods, to 2008. There were 13,352 outbreaks with about 272,000 illnesses during that time.
The authors found that 4,887 outbreaks, with about 128,000 illnesses, had an implicated food vehicle and a single cause (pathogen). But they excluded about 300 outbreaks because there was too little information to categorize the food ingredients. They ended up with 4,589 outbreaks that met their criteria.
The team divided foods into three major groups, encompassing 17 commodities, as follows:
- Aquatic animals: fish, crustaceans, and mollusks
- Land animals: dairy, eggs, beef, game, pork, and poultry
- Plants: grains beans, oils-sugars (refined plant foods), and produce, including fruits-nuts, fungi, and leafy, root, sprout, and vine-stalk vegetables
The 4,589 outbreaks identified by the authors included 120,321 illnesses caused by 37 agents. Norovirus caused by far the most outbreaks, 1,419, and illnesses, 41,257, as compared with a median of 29 outbreaks and 1,208 illnesses for all pathogens. The implicated food vehicle was complex in 49% of the outbreaks.
The team estimates that about 51% of foodborne illnesses were related to plant commodities, 42% to land-animal commodities, and 6% to fish and shellfish. Citing a previous CDC estimate of 9.6 million foodborne illness cases per year in the United States, that comes out to 4.9 million, 4.0 million, and 600,000 cases, respectively.
Of the 17 commodities, leafy vegetables led the list for the largest share of illnesses at 17%, but the wide range between the team's low and high estimates indicates that leafy vegetables were often part of complex foods. Next on the list were dairy foods, implicated in 14% of illnesses; fruits and nuts, 12%; and poultry, 10%.
The authors calculated that the outbreaks caused 57,462 hospitalizations. Forty-six percent of those were attributed to land-animal commodities, 41% to plant commodities, and 6% to fish and shellfish. Among specific commodities, dairy foods accounted for the most hospitalizations at 16%, followed by leafy vegetables, poultry, and fruits-nuts.
The total number of deaths was estimated at 1,451. The team calculated that land-animal foods accounted for 43% of these, plant-based foods for 25%, and fish and shellfish for 6%. As noted above, poultry topped the list of single commodities implicated in deaths, with 19%. It was followed by dairy, vine-stalk vegetables, fruits-nuts, and leafy vegetables.
Of the deaths attributed to poultry, most were blamed on Listeria (63%) or Salmonella (26%). The authors observe that the poultry-linked listeriosis numbers were swelled by three large outbreaks in the 1998-2002 period that were linked to turkey deli meat that was contaminated after cooking.
Concerning the 46% of all illnesses attributed to produce, the authors comment, "The large number of norovirus illnesses was a major driver of this result." They said a previous study showed that produce-containing foods were the source of about half of norovirus outbreaks with a known simple food vehicle in 2008.
One limitation of the study, the authors say, is that there were no outbreaks caused by Toxoplasma species or Vibrio vulnificus, which are uncommon but have a high fatality rate. Because Toxoplasma infections are often linked to meat, the exclusion of this pathogen from the study may have magnified the relative role of poultry as a cause of fatal illnesses.
"Our estimates should be considered an approximation, to be refined by further research and analyses," the report says.
In the Q&A statement, the CDC stressed that the findings should not scare people away from eating fruits and vegetables, which are linked with a reduced risk of many chronic diseases.
Qualified praise
Craig Hedberg, PhD, a foodborne disease expert and associate professor of occupational and environmental health at the University of Minnesota, praised the study but cautioned about drawing hasty conclusions from it.
"I really like the fact the CDC is actually using their outbreak data more," he said in an interview. "There's a tremendous amount of information there, and the more they use it, the stronger the signal it sends out to state and local health that this is important information and we need to do a good job of reporting and documenting these outbreak investigations, which will add to the data."
At the same time, he said, "The way that the data are presented and the way food items are classified winds up leaving us with pictures that really need further clarification. . . . We have this farm-to-fork continuum, and aggregating things on the level of food animals doesn't really tell us where on that continuum you need to deploy your resources [for preventing contamination]. It's a helpful first step in aggregating the data, but it doesn't give all the info we need to figure out where to go next."
Hedberg cited the findings on produce as an example. "Leafy greens are going to be the biggest source of illness, but most of that is going to be due to contamination at the point of service—a food worker who contaminates a salad. It's really not a problem of leafy green production; it's a problem of what happens at the restaurant level."
"Knowing it's a first step, we need to look at where we need to go to understand what the practical control measures are going to be," he added.
Painter JA, Hoekstra RM, Ayers, et al. Attribution of foodborne illnesses, hospitalizations, and deaths to food commodities by using outbreak data, United States, 1998-2008. Emerg Infect Dis 2013 March;19:3 (Early online publication) [Full text]
See also:
Jan 4 CIDRAP News story on FDA's proposed produce safety rule


